Ask the Agent to separate printed numbers from geometry estimates, and to keep that label in the output. Charts in Busabase docs or files are pictures of data — an Agent can read labels reliably when they are drawn as text, but bar heights and line positions are estimates unless a table is also present.
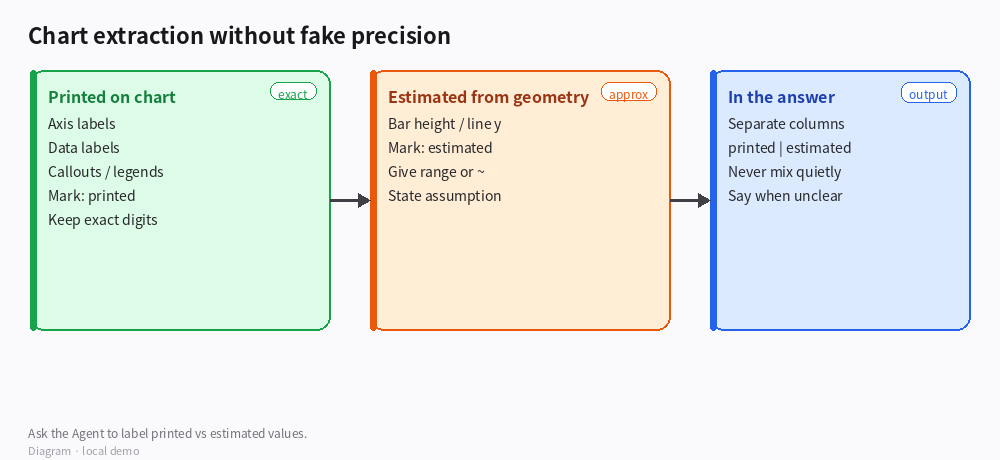
*Diagram · Printed vs estimated values in the answer*
Prompt pattern (copy / adapt)
Extract figures from this chart for [topic].
For every number, set source to exactly one of:
- printed — digits visible as text on the chart (axis tick, data label, callout, legend)
- estimated — inferred from bar height, line position, or area; give a range or “≈” and the assumption
- unclear — say what is missing

Output a table: label | value | unit | source | confidence
Do not present estimated values as if they were printed.
If both a printed label and a bar exist and they disagree, report both and flag the conflict.
Prefer the underlying table/CSV in the same document when one exists.
How to use it
- Point the Agent at the specific page / image / doc section (avoid “the whole Space”).
- Require the source column in the answer; reject replies that only dump bare numbers.
- For decisions (targets, compliance), use printed values only; treat estimated as directional.
- If the report also has a data table, tell the Agent to extract from the table first and use the chart only as a cross-check.
How to verify
- Every figure in the reply is tagged printed / estimated / unclear.
- Estimated rows use ≈ or a range, not fake four-decimal precision.
- Spot-check two printed labels against the image yourself.
Boundaries
- Chart extraction is not a substitute for the source dataset; precision cannot exceed what the graphic actually encodes.
- Different Agents / models vary in vision quality — the labeling rule matters more than trusting a single run.
- Do not ask for “exact values from the bars” without allowing estimation language; that encourages overstated precision.
If you share whether the chart sits in a Doc image, a PDF, or an attached PNG, we can tighten the prompt with the right “open this node” wording.